Last updated on June 11, 2024
My thoughts on Python in Excel
Posted by Felix Zumstein - Comments

On August 22, 2023, Microsoft revealed the preview of “Python in Excel”. As creator of xlwings and author of the O’Reilly book Python for Excel, I was obviously curious to give it a try. Since you shouldn’t judge a book by its cover, I decided to take a deep dive and record a LinkedIn Learning course on Python in Excel: Working with pandas DataFrames. Along the way I discovered many bugs and other issues and reported them on GitHub. All of them are either resolved or at least acknowledged/commented by now, which is fantastic, and I only wish it was as easy to report a bug in the Office.js and VBA world.
So what do I think about Python in Excel? Here’s the TL;DR:
- We wanted an alternative to VBA, but got an alternative to the Excel formula language
- Integrating the Jupyter notebook cells inside the Excel grid was a mistake
- Python in Excel isn’t suitable for Python beginners nor for interactive data analysis
- Right now, there are too many restrictions (can’t use your own packages and can’t connect to web APIs)
- Here are the current use cases I see for Python in Excel:
- Computationally intensive things like Monte Carlo simulations
- AI stuff via the included packages (scikit-learn, nltk, statsmodels, imbalanced-learn, gensim)
- Advanced visualizations via Matplotlib/Seaborn
- Time-series analysis (this is one of Excel’s blind spots)
- Not sure about data cleaning/data analysis: since you almost certainly need Power Query, it may actually be simpler and faster to just stick to Power Query (instead of using Power Query and Python in Excel together)
Before we dive into the details, I want to clarify that this is just my personal opinion and is not meant to be a rant or critique. I’ve been in contact with the Excel team a few times along the way, and they are all super friendly and I value their interest in my opinion. Unlike me, they have to work with almost 40 years of Excel history and a ton of corporate overhead. Given these restrictions, they are doing an excellent job!
(Also check out the related discussions on HackerNews and Reddit.)
Table of Contents
- Make something people want
- The mistake: placing the Jupyter notebooks cells inside the grid
- Python in
Excelthe Cloud - A glue language without glue
- Matplotlib is great, but a little interactivity wouldn’t hurt
- No access to the Excel object model
- DataFrames are great, but so are NumPy arrays and lists
- A better alternative than “an alternative to the Excel formula language”
- What are my plans with xlwings?
- Conclusion
Make something people want
The Python in Excel story started in 2015 when user “Daniel” posted the following idea on Microsoft’s UserVoice page (which has been migrated to their new feedback forum in the meantime):
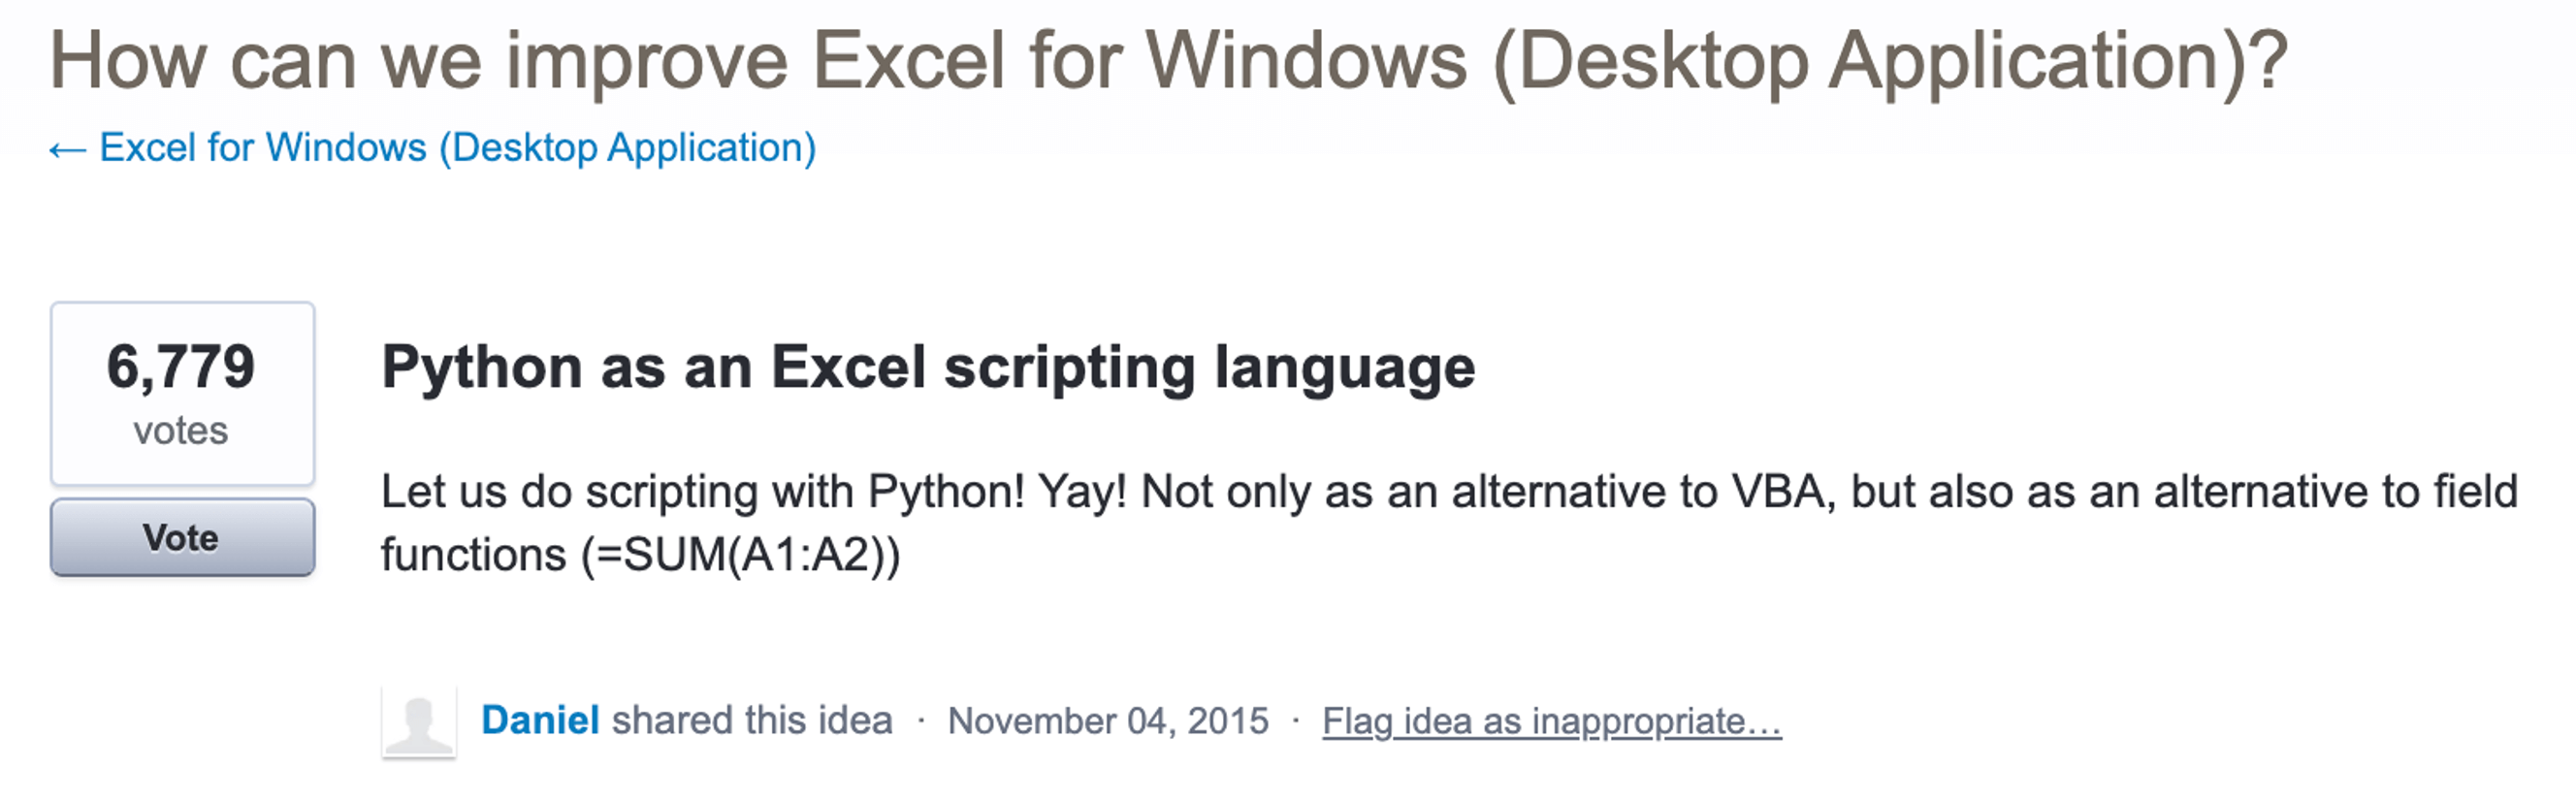
The idea quickly became the most popular one clearly wanting:
- A scripting language
- User-defined functions
Unfortunately, Python in Excel doesn’t support either of these two features. Instead of being an alternative to VBA, it’s designed to be an alternative to the Excel formula language. While I don’t think there’s anything wrong with Excel’s formula language, Python in Excel is really just a 2-dimensional Jupyter notebook inside the Excel grid. It uses a real Jupyter notebook kernel, by the way, that runs in the Azure cloud. This means that you can use notebook magics such as %%timeit, which is a cool thing!
John Lam, a Principal Architect on the project, told the Real Python Podcast that this implementation was just thought to be “a crazy idea”, but eventually it was picked by those people who call the shots at Microsoft. In my opinion, it should have remained a crazy idea, as I will explain in the next section.
The mistake: placing the Jupyter notebooks cells inside the grid
Python in Excel could have been straightforward by integrating a Jupyter notebook as a task pane in Excel. A Python developer would feel right at home, with the benefit that they can directly read and write from the Excel cells. On the other hand, Excel users can start dabbling around with Python in a “standard” environment and don’t have to learn a new tool when they move on from Excel. So what’s wrong with placing the notebook cells inside the grid?
It looks like a duck, but it ain’t one
Everyone knows how a spreadsheet works: you put in numbers and formulas in the cells, and everything just works because Excel figures out the dependencies of each cell and recalculates those that need to be updated when a specific input changes. It certainly doesn’t matter where on the spreadsheet these cells are.
Well, Python in Excel breaks this core spreadsheet truth: despite behaving very similarly to user-defined functions (“UDFs”), PY cells are evaluated from left to right and top to bottom. This includes the sheets, so the first sheet gets calculated before the second sheet, etc.
Do repeat yourself
When Office Scripts was introduced, it was such a relief that the code (unlike with VBA) was stored outside of the Excel workbook on SharePoint/OneDrive. All of a sudden, you could use the same code with multiple workbooks, without having to do any copy/pasting. This also means you can fix your code in exactly one location when you discover a bug. Life is good. Actually, it would have been even better if the Office Scripts file would be a regular TypeScript file that could be tracked on GitHub, but that’s a different story.
Now, Python in Excel stores the code in the Excel file itself. To the end user, the code lives in the cells, but technically, it’s stored under /xl/pythonScripts.xml inside the Excel workbook (i.e, in the ZIP file). So back to copy/pasting, yay!
Magic, magic everywhere!
Whenever you want to write out a pandas DataFrame (or any other Python object) to the Excel cells, you need to switch from Object to Values mode (the button on the left of the formula bar). There are 2 issues with that:
-
When the DataFrame uses the default integer index, it’s hidden when turning it into values. If that index is either text or non-default, it is shown. Magic!
Imagine that you have 100 PY cells, and in cell 3 you set the
idcolumn as DataFrame index. This means that in cell 100, where you convert the Python object into values, you all of a sudden have one column more. -
Switching from Object to Values mode changes the formula from
=PY("...", 1)to=PY("...", 0). This is, however, hidden from the user as the user only sees the Python code in the cell (the"..."part of the formula). Magic!I see two main issues with that:
- It prevents you from referencing a cell with a Python object directly, as you’re always running the risk that someday, someone switches that cell to Values mode, which would break any formula that references this cell in object mode.
-
PY cells in object mode behave differently than any other object cell (“Excel (rich) data types”). Take the stocks data type: the cell is always an object and you can show its price by doing
=A1.Pricein a different cell. PY cells could behave the same: if you want the values, you would write=A1.Values. A little consistency goes a long way.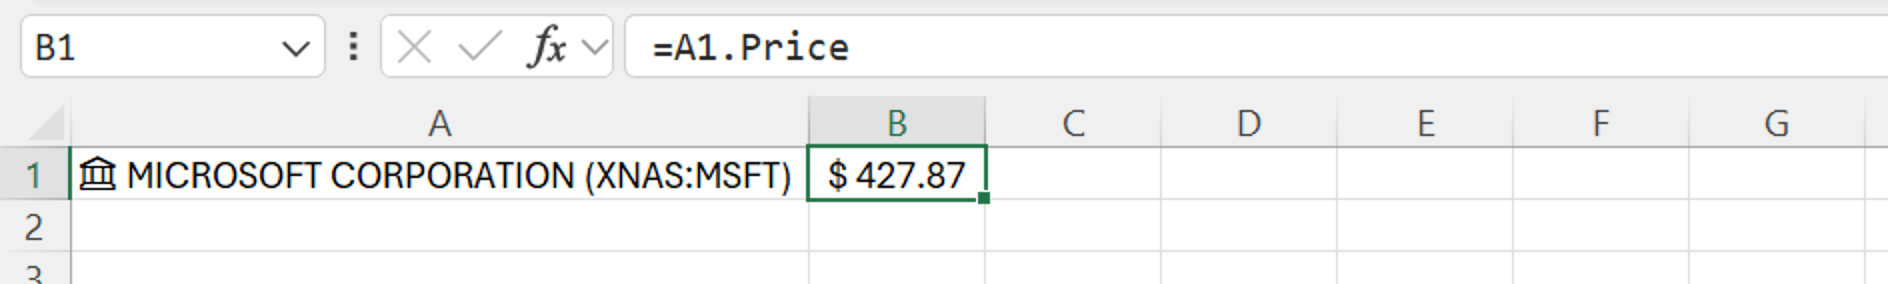
Non-interactive data analysis
I primarily use Jupyter notebooks for interactive data analysis or for trying things out in incremental steps. You type a few lines of code in a cell and hit Shift+Enter to evaluate the cell, look at some intermediate result and continue with the next cell.
With Python in Excel, I don’t see the output of the cell, unless I:
- Change the cell type from Object to Values. That’s often not possible as this requires having enough space around the cell.
- Click on the preview icon, which opens a pop-up window. That’s a lot of work (even with the
Ctrl+Shift+F5keyboard shortcut) and the preview window often isn’t all that helpful: it’s too small and the values are shown in the Excel cell representation instead of how a Jupyter notebook would show it. This is supposed to be fixed at some point, but right now, almost 1 year after the initial version, it still shows#N/Ain the preview so I don’t know if that is anp.nan,pd.NA, orpd.NaT.
Too much friction in the workflow means I am just not considering Python in Excel for interactive data analysis, unfortunately!
Diagnostics pa(i)ne
I would call the diagnostics pane the biggest offender in Python in Excel. It starts with the unnecessarily technical name (why not simply call it Output like in VS Code?).
Anyhow, the diagnostics pane shows whatever you print() in your cells as well as any error messages. So whatever a Jupyter notebook shows directly underneath the cell. But since Python in Excel pulls the output away from the cell, you have to manually associate the output back to the proper cell. Here are two examples:
-
When looking at a DataFrame, typically the first thing you run is
df.info(). Now, since this prints the output, whenever Excel recalculates the Python cells, the Diagnostic pane shows up. That’s not just annoying, it’s also completely impossible to quickly relate the output on the diagnostics pane with the corresponding cell. It also keeps the output from the last run to make it even harder to find the lines that you’re after (a monospaced font would also help, by the way). So which output is mydf1, and which one is mydf2? I have no idea unless I look up the code that is sitting in cellsL2andK2: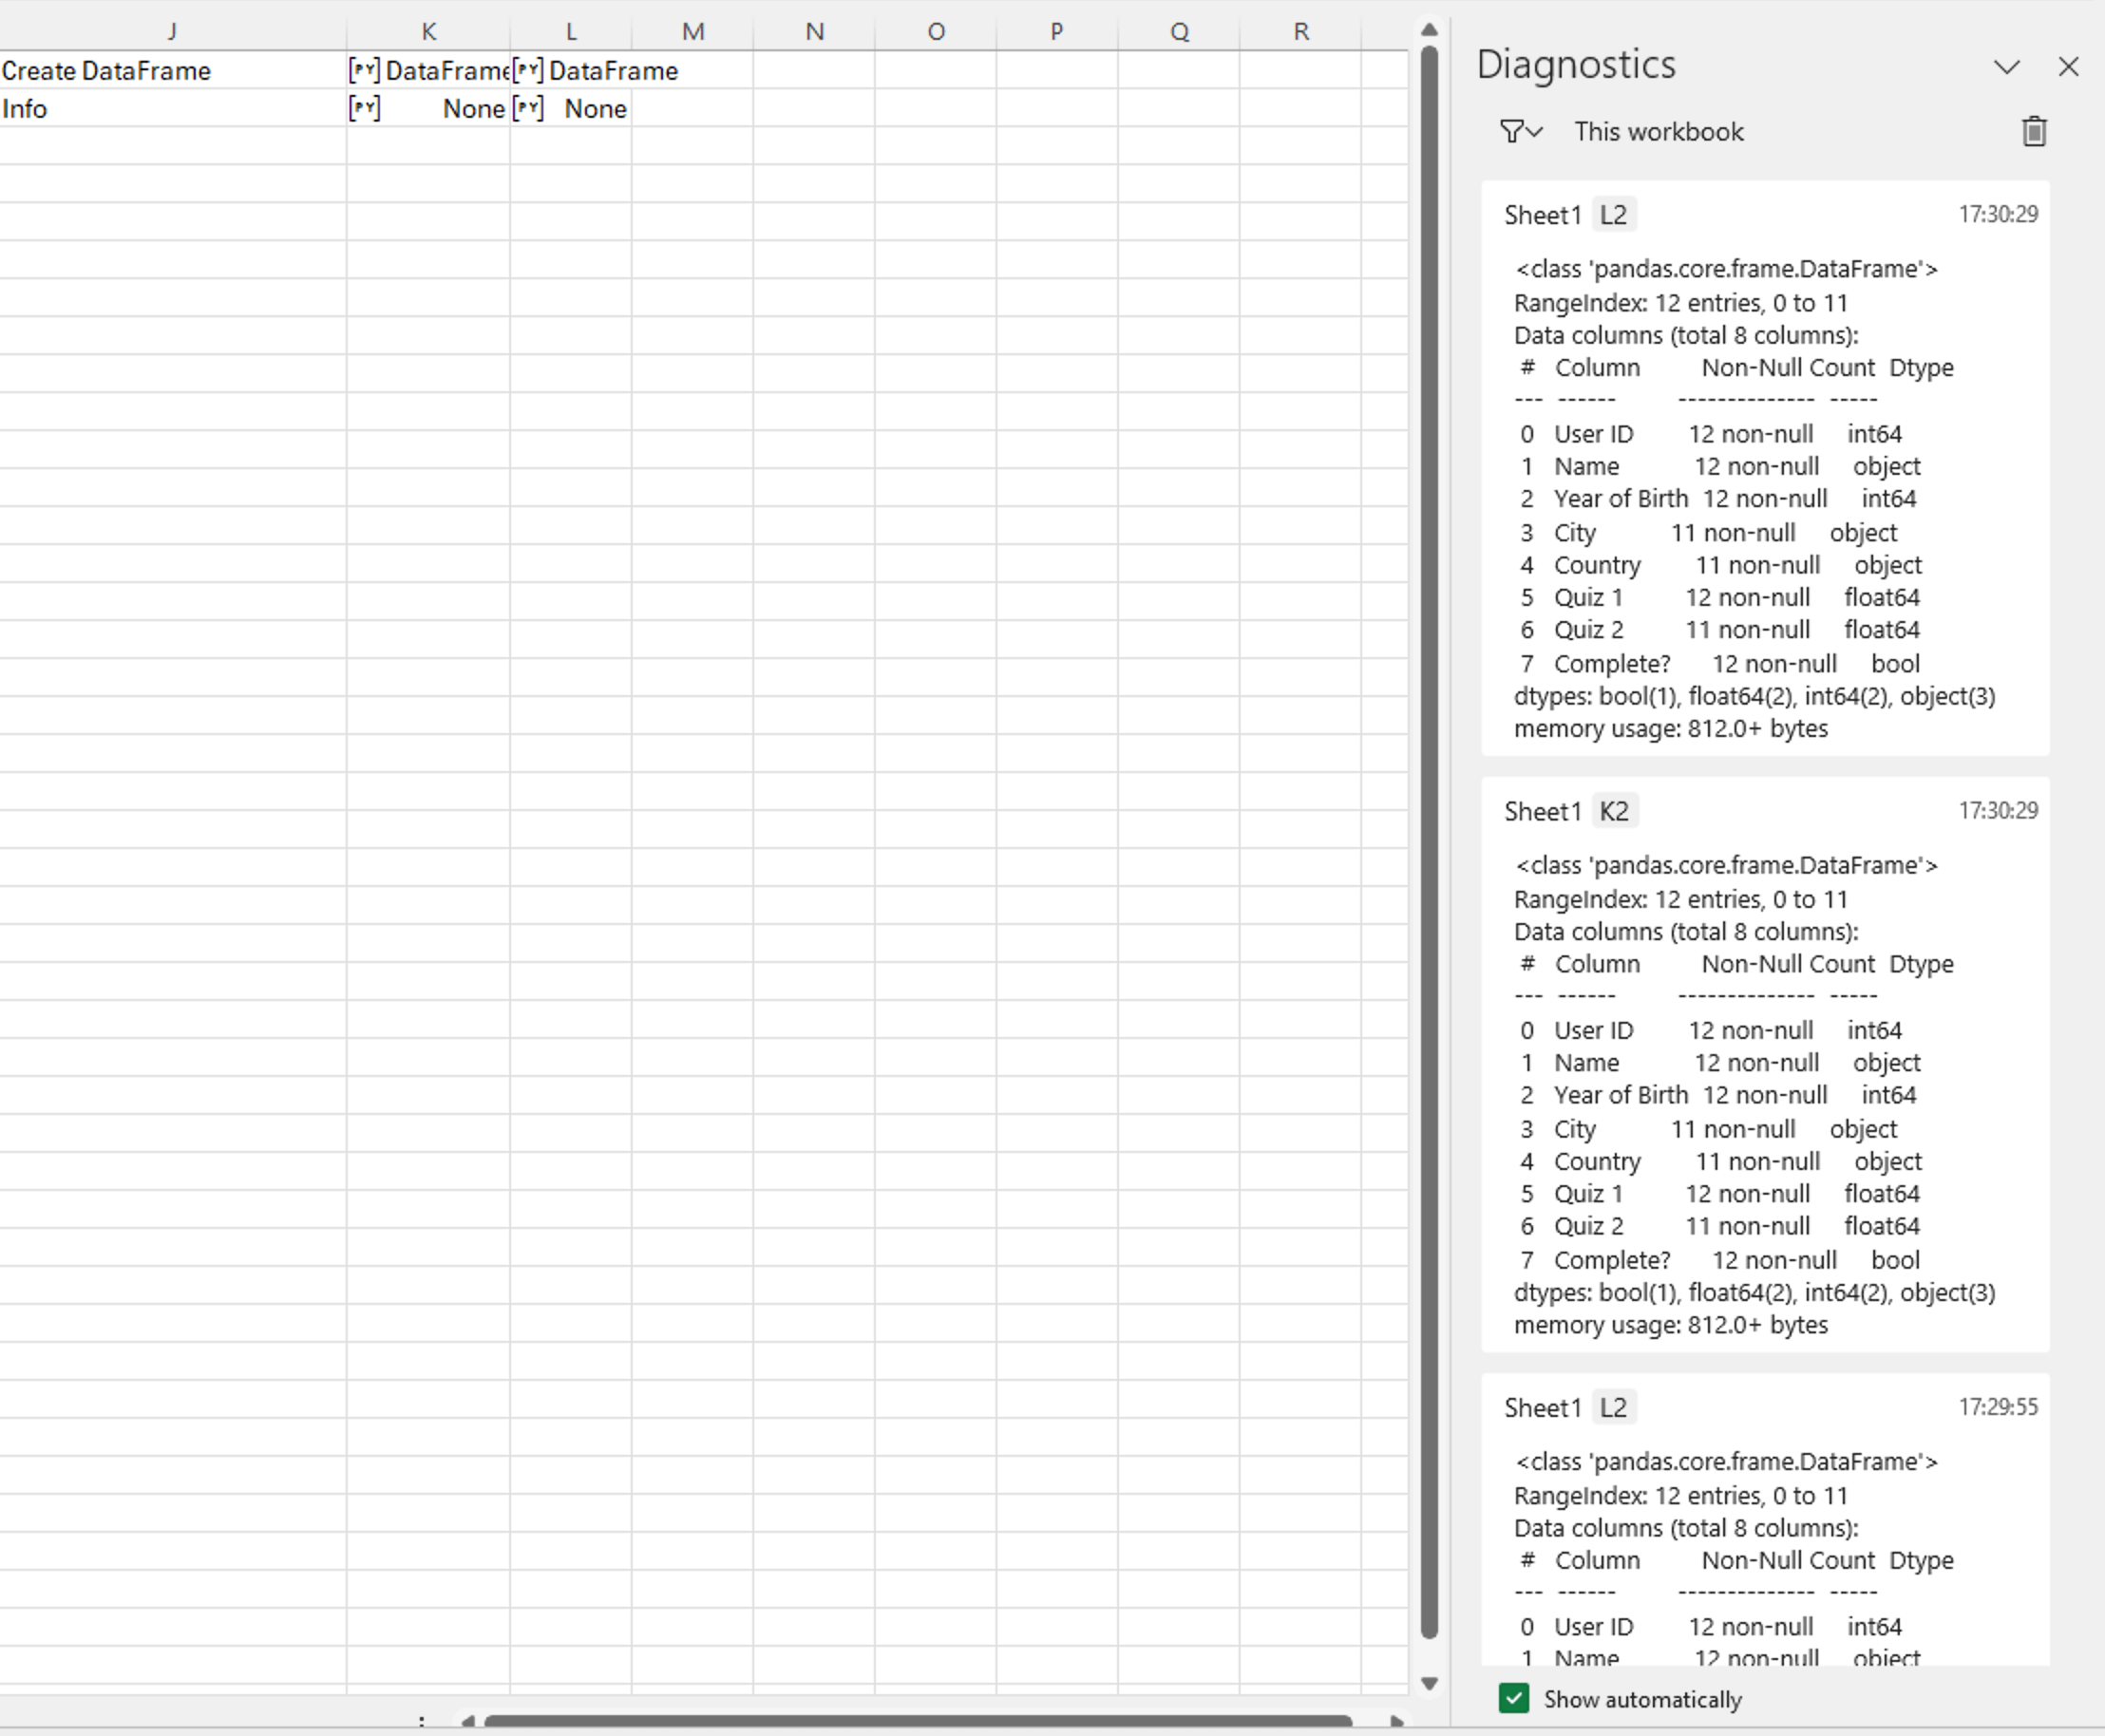
-
The same happens with exceptions. Try to find the error in the following screenshot (the error happens in
K2, which has already disappeared at the bottom of the diagnostics pane)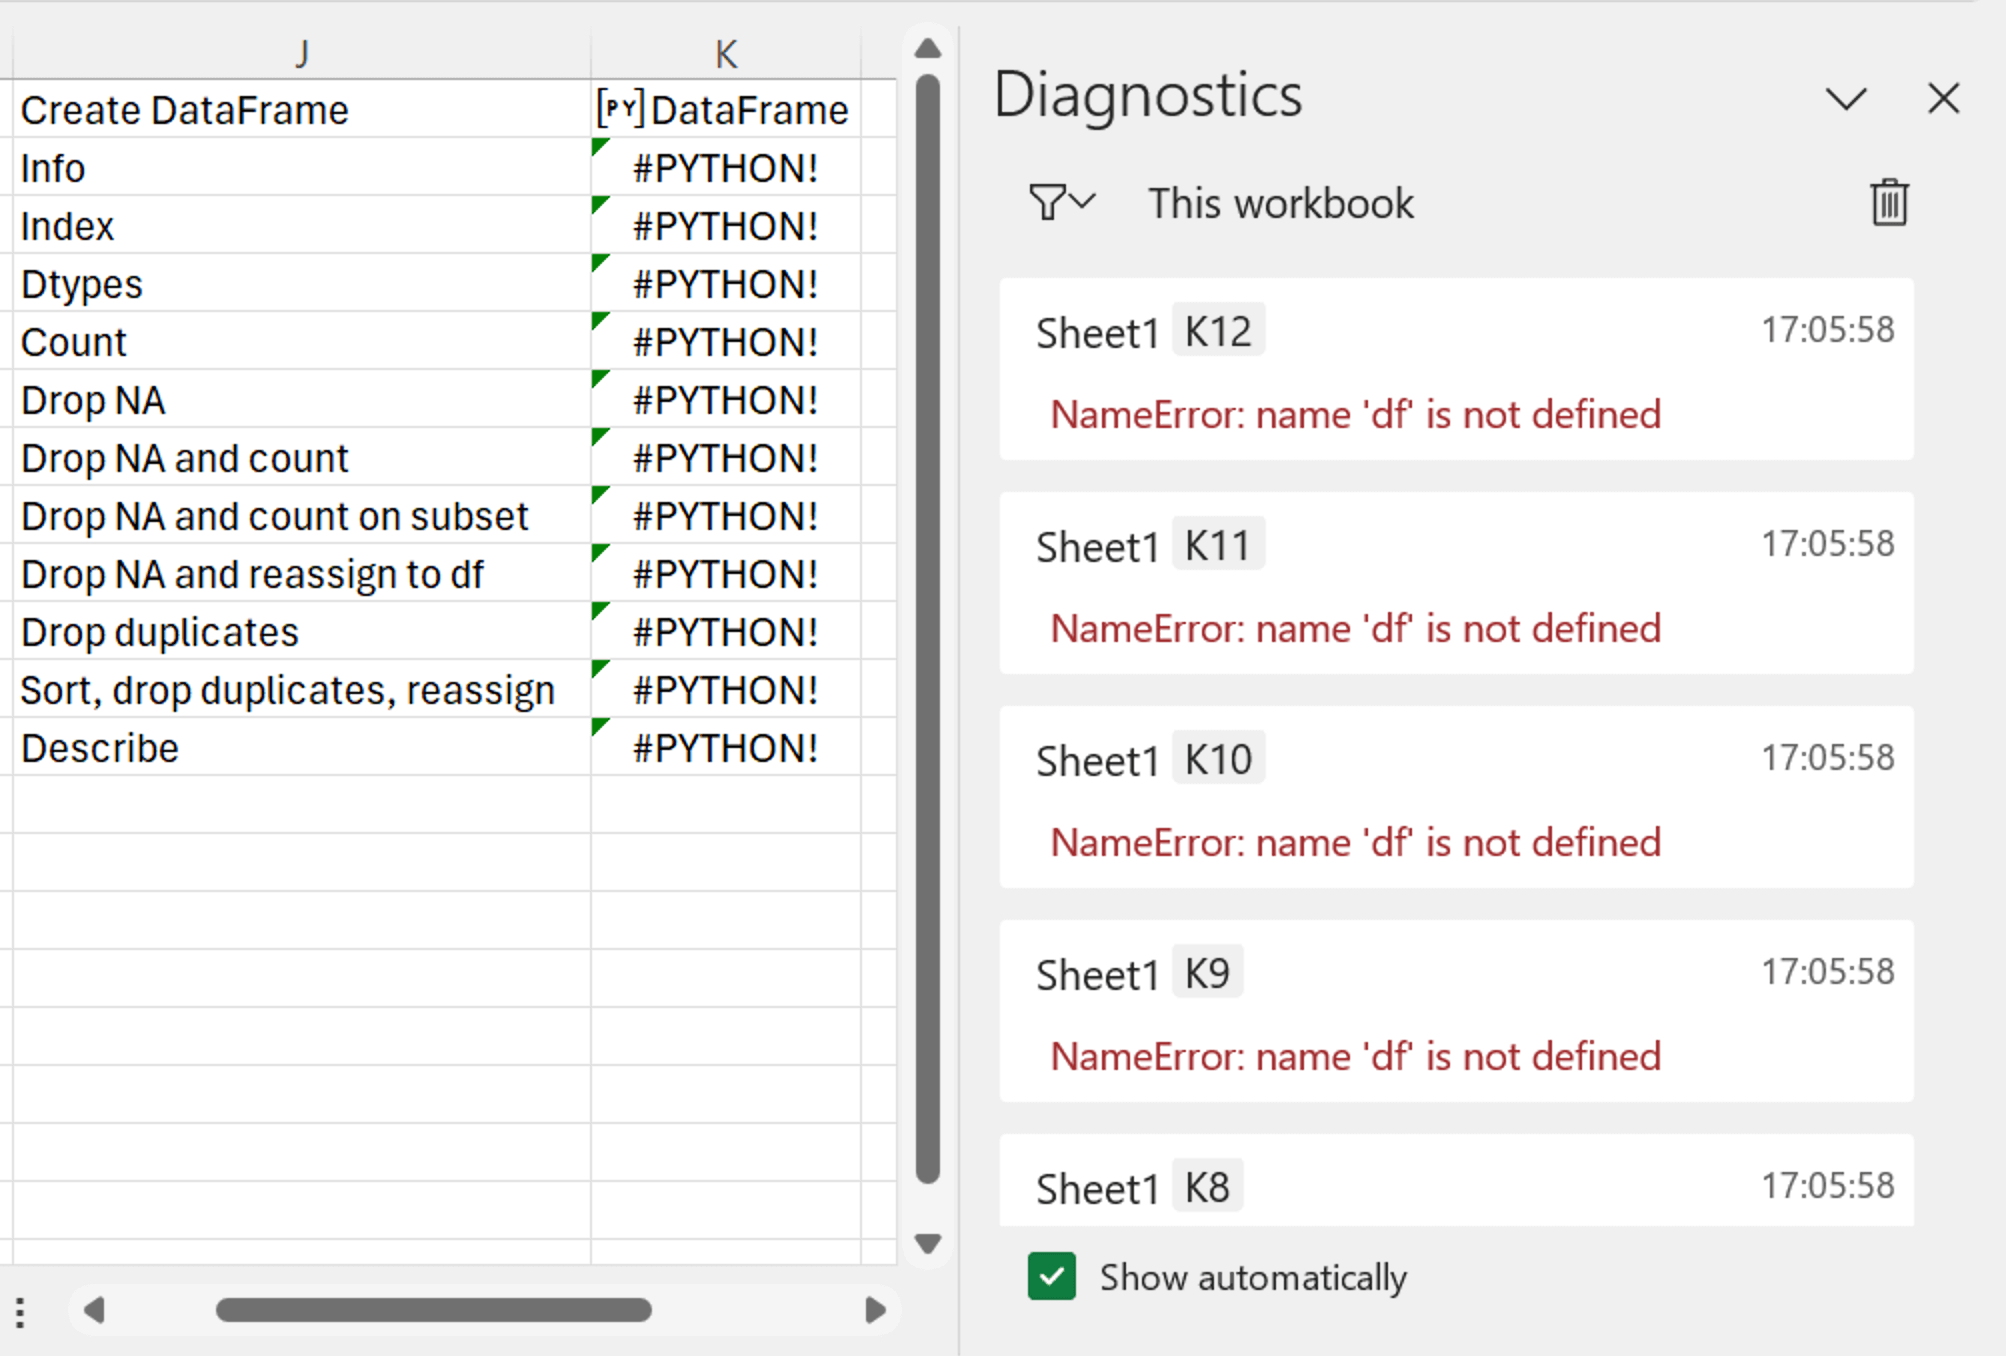
As a beginner Python coder, a crucial thing is to get easy feedback on your errors. That’s not the case here, which is why I don’t consider Python in Excel a good solution for Python beginners.
As an idea, the preview pop-up could be a much better place to show the output without loosing the context. Also, coloring the cell or the PY icon in red when there’s an error could help further.
Python in Excel the Cloud
As you’ve probably heard, Python runs in the cloud on Azure Container Instances and not inside Excel. There was a lot of backlash on social media about that (“privacy, privacy!”), but what these commenters are missing is that the majority of corporations already trust Microsoft with all their data by using OneDrive/SharePoint.
In fact, I agree that the cloud is the best way to bring Python to Excel. The maintenance and installation of a local Python environment simply isn’t possible for the inexperienced and when teams are bigger than a handful of people. The only other option is Web-Assembly (WASM), but it looks like the Excel team left this as an exercise for me to implement (see the end of this post).
What you need to keep in mind though is that Python in Excel will cost an extra subscription fee on top of Microsoft 365 (we don’t know how much yet) and there seems to be a quota: while I was recording my LinkedIn Learning course, I was greeted by this message:
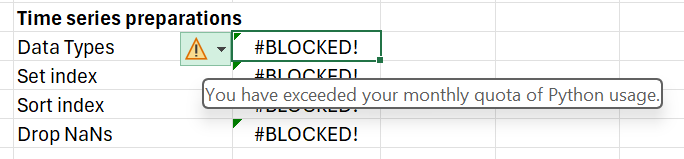
While this is annoying enough when you’re supposed to record your videos, it’s pretty much unacceptable when you use your Excel spreadsheet for trading at a Hedge Fund (yes, that’s still a thing). And even if there would be no quota, the Azure cloud sometimes goes down and your Python cells won’t work—something to keep in mind.
All this to say that I wouldn’t use Python in Excel for something critical as long as I can’t switch to a self-hosted or local server when the cloud is down.
A glue language without glue
Much of the reason why people love Python is that it’s a “glue language.” With Python you can connect what needs to be connected, as there’s a package for everything. So a typical workflow might look like this: you download a few files from a web API, get data from a database, push everything through a pandas or polars DataFrame and finally send out an email with the results.
Well, such a basic workflow isn’t possible with Python in Excel. You can’t install any additional package and your code runs in a steel box, meaning that you can’t connect to the outside world via web API or database connection. The official solution is to use Power Query to acquire external data, as Python in Excel can then reference a Power Query. But really, one of the reasons I want Python and pandas in Excel is specifically to avoid Power Query (I don’t want to learn the M language), so I am not a big fan of this solution.
Here’s what I don’t understand:
- Python in Excel runs on Azure Container instances. And Azure Container Instances can use your own container with all the dependencies you wish for, so I can’t really understand why the Excel team said in one of their Reddit AMAs that the dependencies would have to be installed every time from scratch when somebody opens the workbook. That’s just BS as the container image is built once and then sits there with all the dependencies ready when somebody opens the workbook next time.
- If I can access web APIs via Office Scripts, why not with Python in Excel? As far as I know, the Office admin can restrict what Office Scripts can access, so I’d expect something similar to arrive with Python in Excel one day.
In summary, missing packages and blocked internet access means that you can’t use Python in Excel for many of the use cases that had people scream for Python in Excel in the first place.
Matplotlib is great, but a little interactivity wouldn’t hurt
Python in Excel offers Matplotlib and Seaborn (which is based on Matplotlib) to create plots where Excel charts may be too basic. That’s great and definitely needed, but the output is a boring static picture. xlwings has offered this for the last 10 years. What I am missing here is access to the modern interactive charts like Plotly, Bokeh, Altair, HoloViews, etc.
No access to the Excel object model
People use Excel for reporting all the time. And a super common use case is to consolidate one or more workbooks with data on multiple sheets. For example, there’s a sheet for each month or store location or department. With Python in Excel, you have to select the data on each sheet manually to get ahold of all the data:
jan = xl("Jan[#All]", headers=True)
feb = xl("Feb[#All]", headers=True)
mar = xl("Mar[#All]", headers=True)
...
df = pd.concat([jan, feb, mar, ...])
Good luck if you have weekly data or 100 departments to consolidate. If Python in Excel would give you access to the Excel object model (like VBA or Office Scripts), it would look something like this (the sample shows xlwings syntax):
data = []
for sheet in workbook.sheets:
    data.append(sheet.tables[0].range.options(pd.DataFrame).value)
df = pd.concat(data)
And talking about reporting: everyone wants their own color and cell border formatting, but without access to the Excel object model, that’s out of reach, too.
DataFrames are great, but so are NumPy arrays and lists
As soon as you select more than 1 cell, the xl() function will deliver a pandas DataFrame. I don’t mind this being the default, but it still happens on a very regular basis that you need a list, a NumPy array (or a polars DataFrame!) instead of a pandas DataFrame. And really, this should be easy to get. In fact, you can write your own converter today that solves this problem, only I don’t want to copy/paste this to every workbook…! Here’s how you’d fix this:
def myconverter(x, headers=False, convert=None, **kwargs):
    if convert is None or convert == pd.DataFrame:
        return excel.convert_to_dataframe(x, headers=headers, **kwargs)
    elif convert == np.array:
        return np.array(x)
    elif convert == list:
        return x
    else:
        raise ValueError(f"{convert} is not supported.")

excel.set_xl_array_conversion(myconverter)
Running this code in the Initialization pane (once it’ll be editable, for now place it in cell A1 of the 1st sheet), will allow you to use it the xl() function as usual to get a pandas DataFrame:
df = xl("A1:B2", headers=True)
But it will allow you to also get a NumPy Array:
arr = xl("A1:B2", convert=np.array)
or a list-of-lists:
mylist = xl("A1:B2", convert=list)
It’s just a few lines of code but this isn’t available right now in Python in Excel, which means code duplication and copy/pasting across workbooks.
A better alternative than “an alternative to the Excel formula language”
So I was asking myself: “Are there really no better alternatives than adding Python to improve the analytics capabilities of Excel’s formula language”? I think there is: by improving the native Excel formula language. And in recent years, that’s exactly what Microsoft has been doing. It all started with the dynamic arrays that first appeared in 2018 and that opened the door for powerful formulas like =UNIQUE() or =SORT(). Most recently, Microsoft added the following new functions:
=PIVOT()=GROUPBY()
Wait a minute, that’s half of the reasons why I would create a pandas DataFrame in Excel, so instead of doing df.pivot_table() and df.groupby(), I can now simply stay within native Excel and get proper Excel formulas without all the clunkiness of Python in Excel.
What I find interesting though is the multiline editing experience of PY cells. Why not give the native Excel formula language an upgrade, so I don’t have to write LET expressions such as the following one (that I still find very hard to read):
=LET(x, 1, y, 2, x + y)
Instead, allow me to write it like so?
let x = 1
let y = 2
x + y
Also, why not turn Excel tables into a native Excel DataFrame? Give them attributes instead of sticking to the functional approach and you’d be looking at something like this:
=MyTable[#All].GROUPBY(...)
Lot’s of possibilities to integrate the pandas functionality in a way that feels more native to Excel!
What are my plans with xlwings?
One of the most popular ways of using xlwings has always been to have a Jupyter notebook and Excel running side-by-side. The caveat is that Python is required to be installed locally. That’s an issue, because Python is hard to deploy and maintain with the exact packages you need. There’s also increasing pressure from IT security: they don’t like a full Python installation on an end-user’s machine.
One solution to the problem is xlwings Server, which is self-hosted and runs everywhere where Python runs. However, the use case for xlwings Server is that of a developer, who writes macros and UDFs in Python on the backend. The end-user will access it in the form of a modern web-based Office.js add-in without having to know anything about Python. So it’s not thought for interactive use by the end-user.
That’s why I have started to work on “xlwings Lite”, which will be based on Web-Assembly (WASM). Web-Assembly basically allows you to run Python natively in the browser, while Office.js add-ins run a browser inside Excel. So I “only” need to connect Python running on WASM with the Excel object model. Pyodide, which is a Python distribution based on WASM, will help me achieve this.
While it’s likely going to take me a few more months to implement this, what I can tell from an early proof-of-concept is that it will have these characteristics:
- Supports true custom functions (aka user-defined functions “UDFs”)
- Gives you access to the Excel object model
- Supports Matplolib/Seaborn plots
- Supports web API calls
- It will allow to install your own packages
- Privacy first: everything will run on the user’s machine
- It’s fast
- It’ll support Win, macOS, and Excel on the Web from day 1
- You’ll be able to upload external files without Power Query
- It’ll work on the permanent versions of Office like Office 2021, not just Microsoft 365
- To get it, you will simply need to install an add-in from the Excel add-in store
Basically, I want to build Office Scripts, but with Python instead of JavaScript and running on the user’s machine instead of in the Microsoft cloud.
Conclusion
There’s definitely a place for Python in Excel, but integrating a classic Jupyter notebook instead of placing the cells in the Excel sheet itself would have been much better, in my opinion.
Don’t forget that Python in Excel is still in preview as of today, so we’re likely to get improvements and fewer restrictions in the future.